Funnels
Workflow funnel analytics
Funnels visualizes the journey of work items through your Jira workflow with funnel charts and tree/journey diagrams. See the percentage of work items dropping out at every stage, compare conversion rates, and pinpoint bottlenecks. Use numerical fields as weights to show relative importance. Perfect for sales, marketing, development, or any workflow with stages.
Features
What makes Funnels special
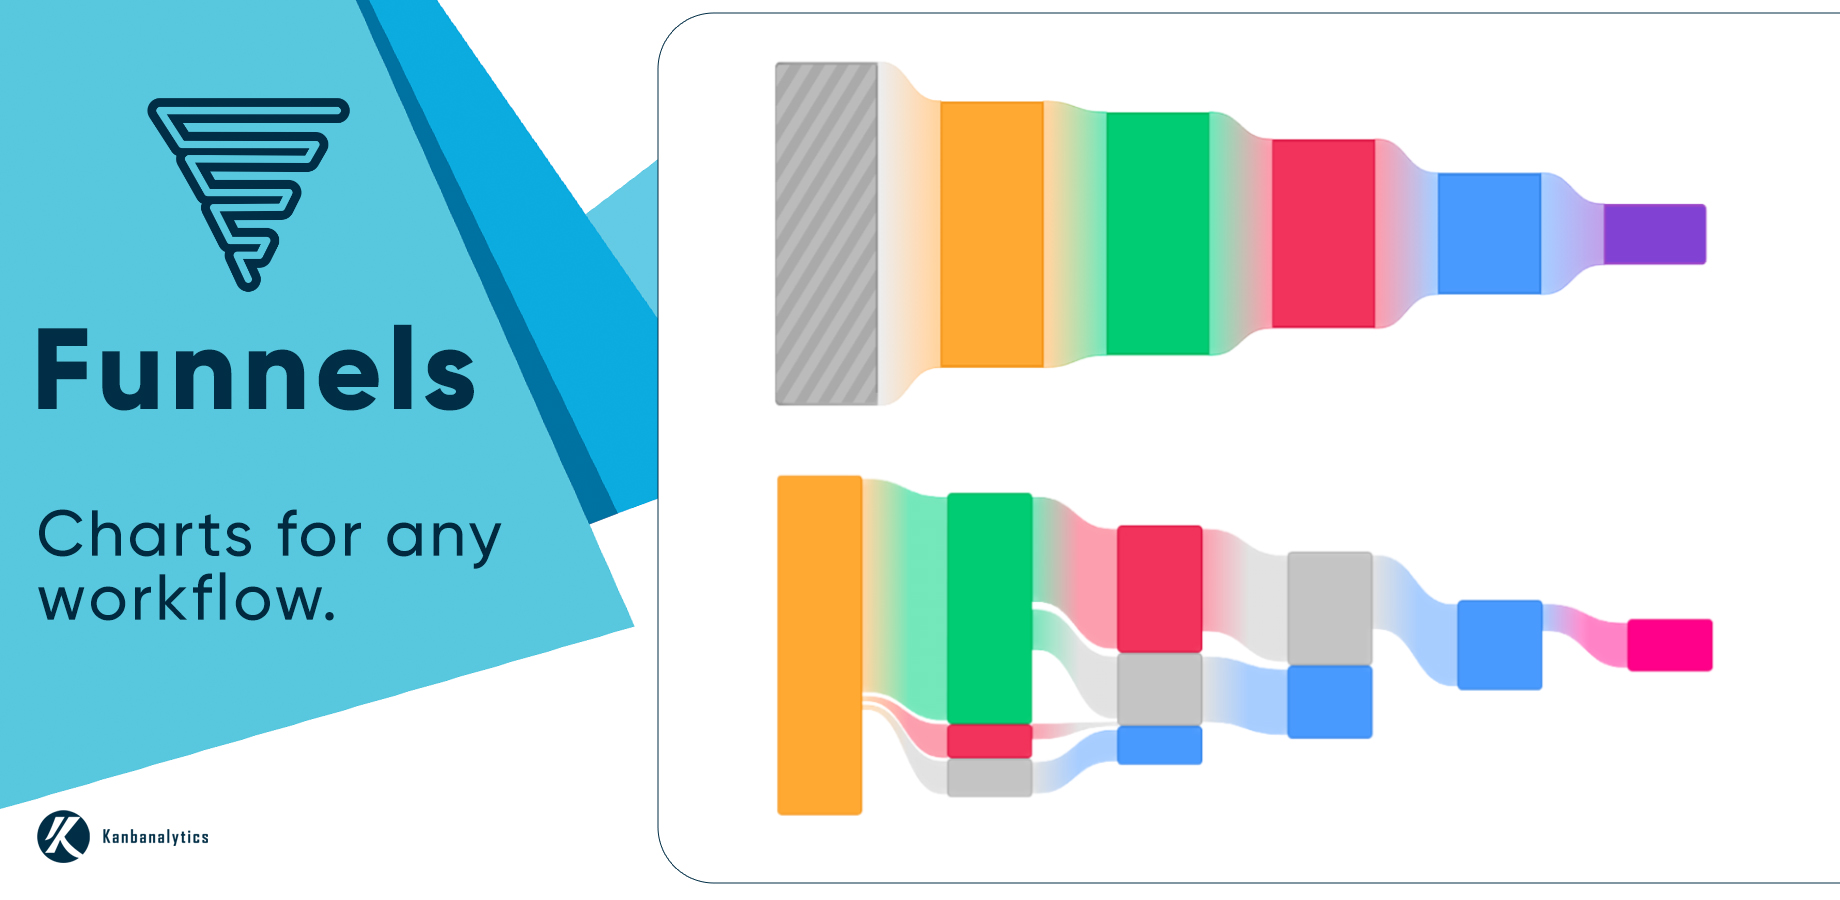
Funnel charts for any workflow
Create clear funnel visualizations for any sales, marketing, or development workflow. See at a glance where the biggest drop-offs occur between stages.
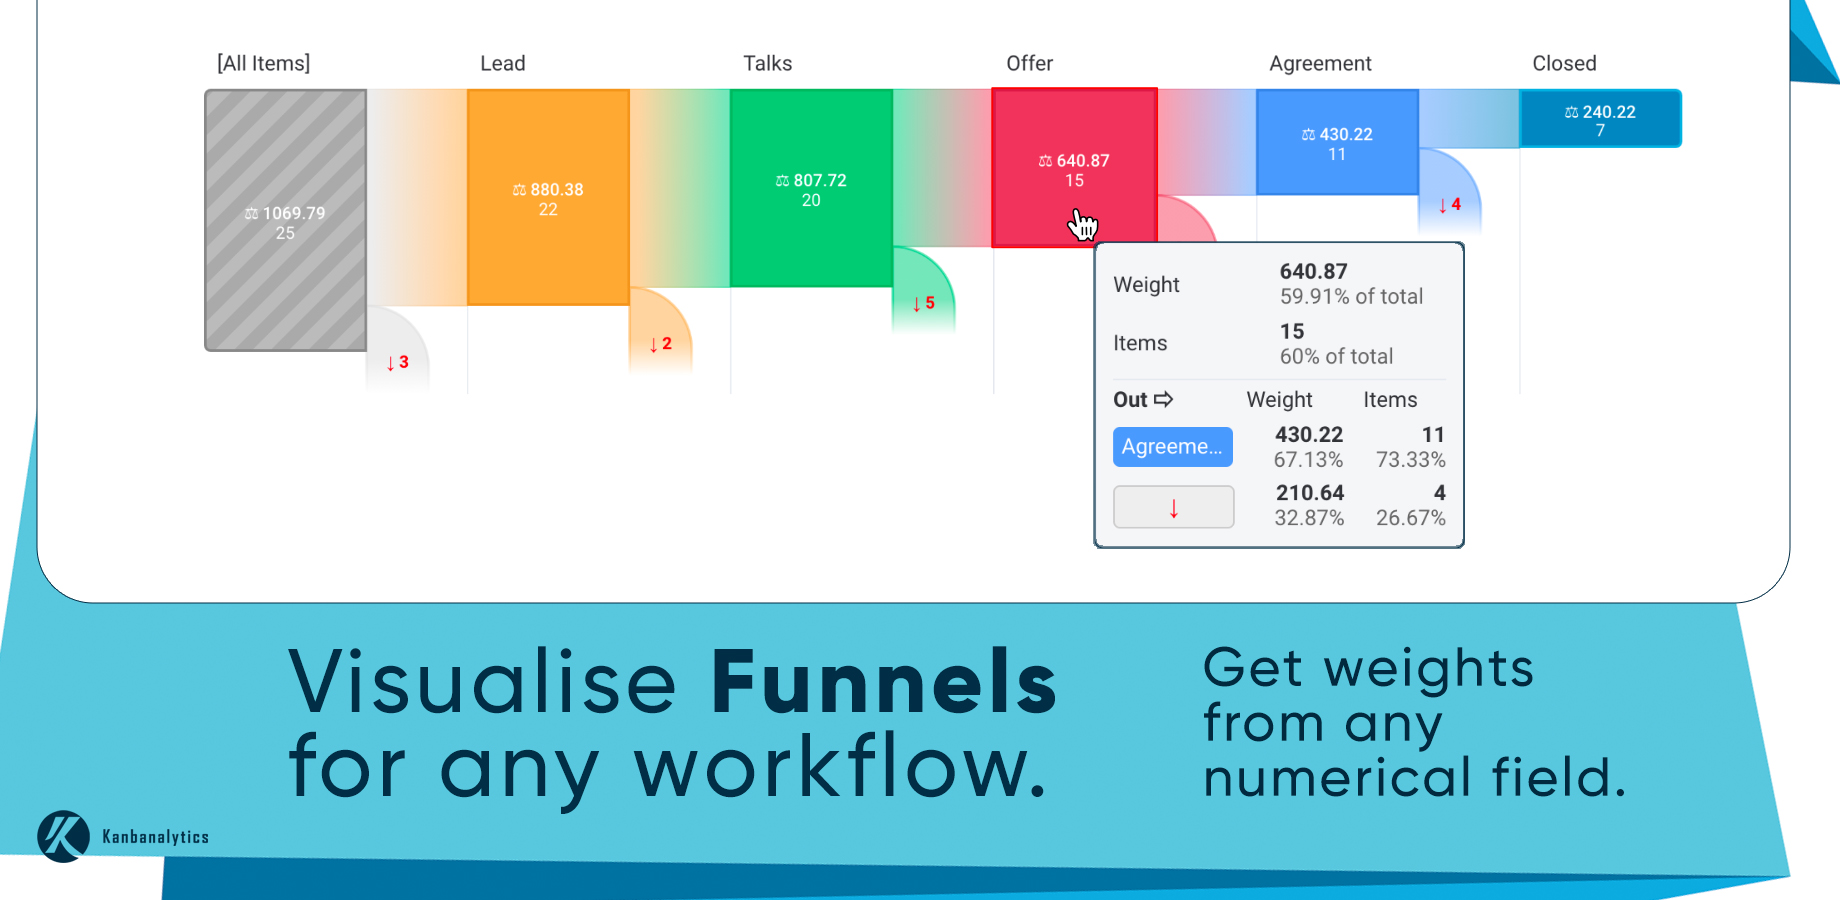
Use weights from any numerical field
Scale elements of your charts using custom weights from any numerical field. See the relative size and importance of items flowing through each stage.
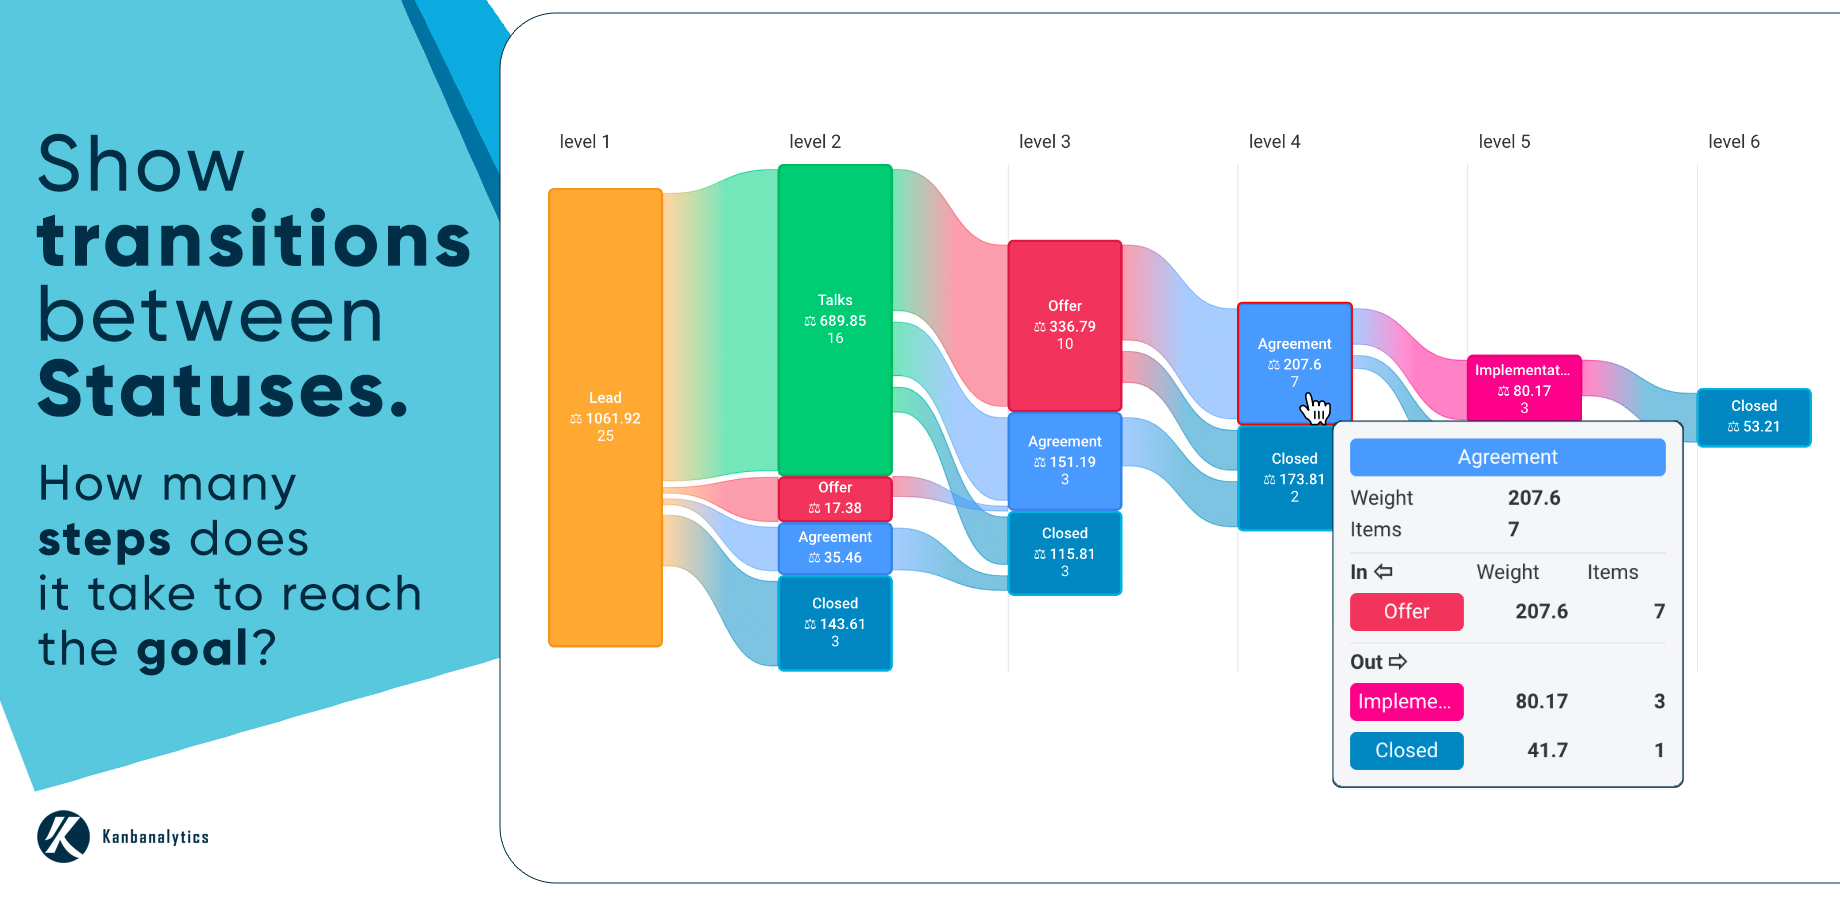
Journey charts show transitions between statuses
Visualize how work items transition across statuses as tree/journey diagrams. Find out how many steps it takes to reach a given status — like closing a sale or releasing a feature.
Benefits
Why teams choose Funnels
Find bottlenecks
Spot the stages where you lose the most prospects, tickets, or features.
Forecast accurately
Predict outcomes based on current funnel state and historical conversion rates.
Fully customizable
Group statuses, show or hide stages, and customize graph scale. Pan and zoom freely to explore your data.
Ready to get started?
Install Funnels from the Atlassian Marketplace and transform the way you work with Jira.